The Qualified Abandon Report and the Respondent Progress Report give access to very similar information, presented in slightly different ways. We’ve grouped these 2 reports in this article to highlight their similarities and differences.
Our Qualified Abandon Report and Respondent Progress Report both allow you to view where respondents are in the survey, and total counts on the respondents who left off at each question. If you have a high abandon rate this report can be useful in identifying if there is a specific question where respondents are abandoning.
For help generating these reports please read our How to Generate Reports article and let us know if you have additional questions!
- When generating either of these reports you will need to filter by Abandons in the Filters drop-down menu. You can also filter by Completes/Terminates/Abandons. The terminate page and the complete page will be considered the “last seen” question for those respondents.
Qualified Abandon vs. Respondent Progress Reports
At first glance, these reports look the same. The bar graph at the top of the screen is great for an “at a glance” overview of where respondents have left off.
The vertical label (y-axis) shows you the question respondents were last active on. The horizontal bars (x-axis) show the number of respondents who were recorded as last active on that question. The bars are proportionate to each other by volume, and have a visible count at the far right of each bar.

For more details on your respondents, look to the list below the bar graph.
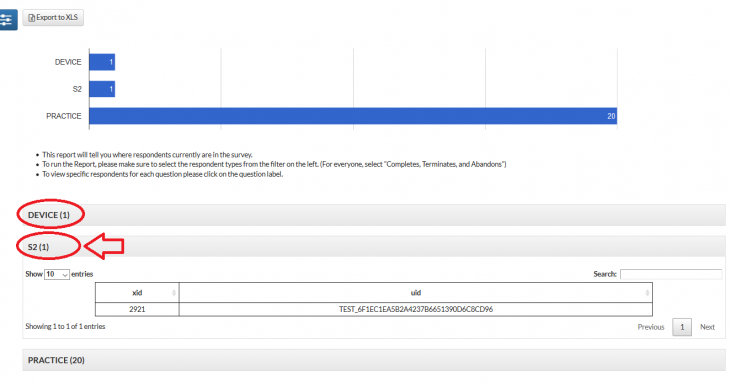
Respondent Progress Report
In the Respondent Progress Report, there is a list of questions that respondents that have left off at, below the bar graph.
Clicking on the question headers will expand the grid to show all Respondent UniqueIDs and XIDs for that question.
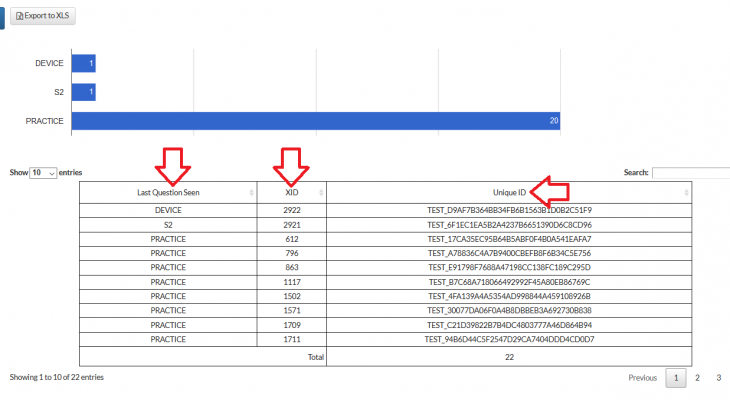
Qualified Abandon Report
In the Qualified Abandon Report, a grid lists the Unique ID, XID, and Last Question Seen for each respondent. This grid is below the bar graph.