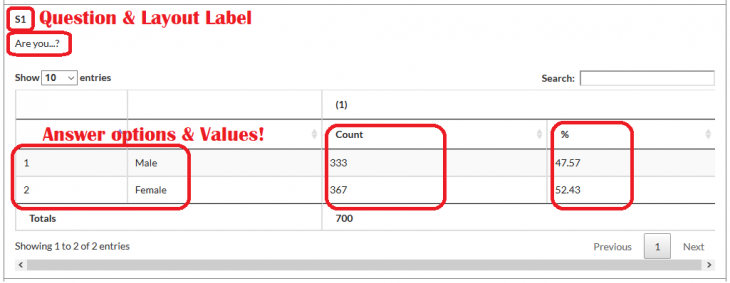
The Topline Report gives you an immediate and granulated breakdown of respondent responses, though it does not give access to respondent IDs. To see responses for specific respondents, you will need to download a data file. For each question in the survey, this report gives you a breakdown of how many respondents selected each answer option, as well as what percent breakdown that count equals for the sample size on that question.
This report also shows hidden question pages, such as quota check and respondent’s device type. This report is standard on all studies, however questions with custom programming may not be available.
For help generating this report please read our How to Generate Reports article, and let us know if you have any questions! All filters are available on this report, including start/end time and combinations of completes, terminates, and abandons.
A basic question in the Topline Report will give you the question number, question text, the answer option values and labels, and the option selected by count as well as % breakdown. Below the grid, the total # of respondents in the breakdown will be shown.
For questions with a large number of answer options, such as a state list, the answer options and counts will appear over multiple pages.
Grid questions are also displayed in the Topline Report and appear much like the nested tracking grids in the Simple Counter Report.


